Climate change is one of the most pressing challenges of our time. At the Packard Foundation, addressing this crisis is one of our highest priorities and we know that decisive action must be taken to avoid the most significant impacts.
As we continue to invest in impactful climate solutions through out grantmaking, it is critical that our own actions are aligned with the future we are working toward. Building on our long-term effort to reduce our own footprint, we are committed to achieving net zero carbon emissions of our organizational operations by 2040.
Net-Zero by 2040
Addressing Climate Change is one of our highest priorities and we know that decisive action must be taken to avoid the most significant impacts.
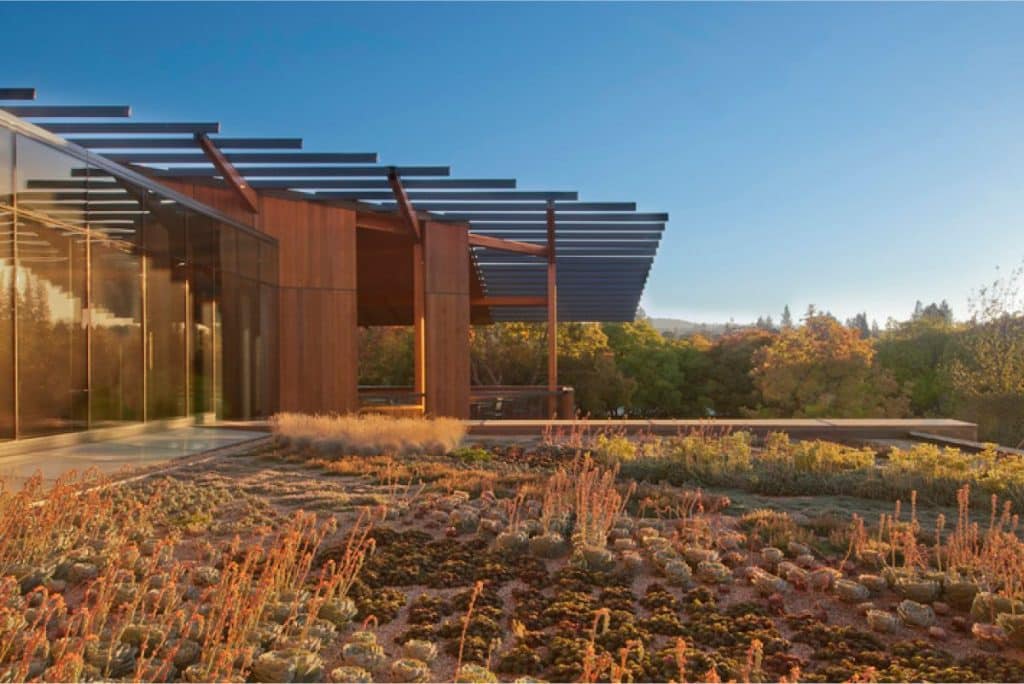
Our green building was designed with a net zero energy goal of producing at least as much power as it consumes each year. Its technological and structural features come together with a beautiful, functional design to create a workspace that is good for the planet and for our employees. Through its energy, water, and resource-conserving characteristics, the building has achieved Net Zero Energy Building™ and LEED® Platinum certifications.
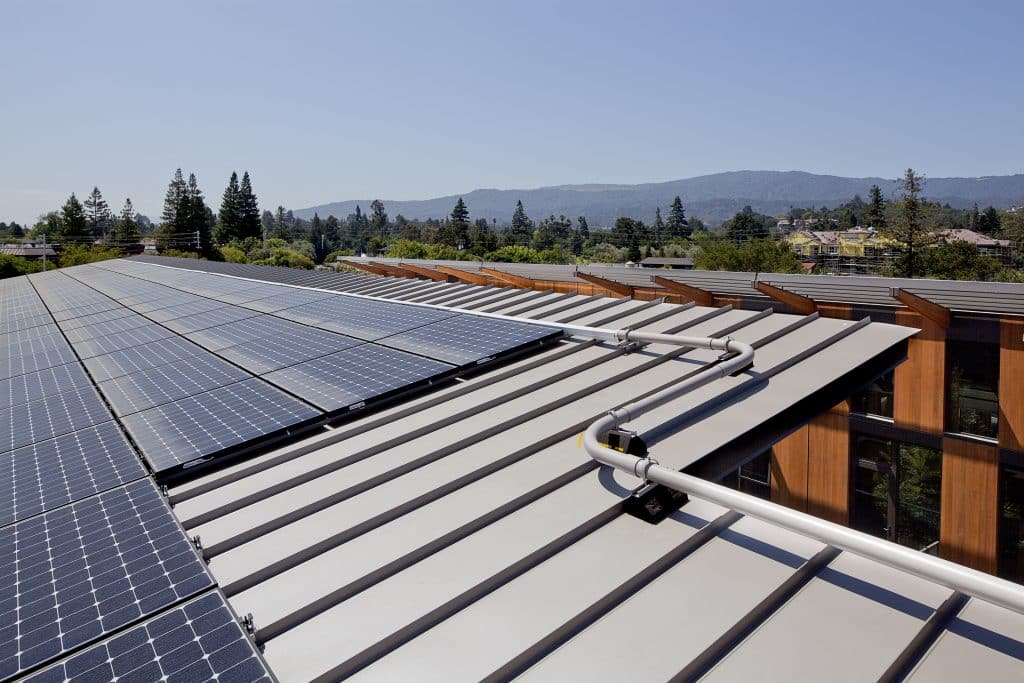
Net Zero Energy
Offset 100% of the building’s energy needs by:
Electricity production via 915 rooftop solar panels
Effective use of daylight to supplement artificial lighting
Efficient heating and cooling using innovative chilled beam technology
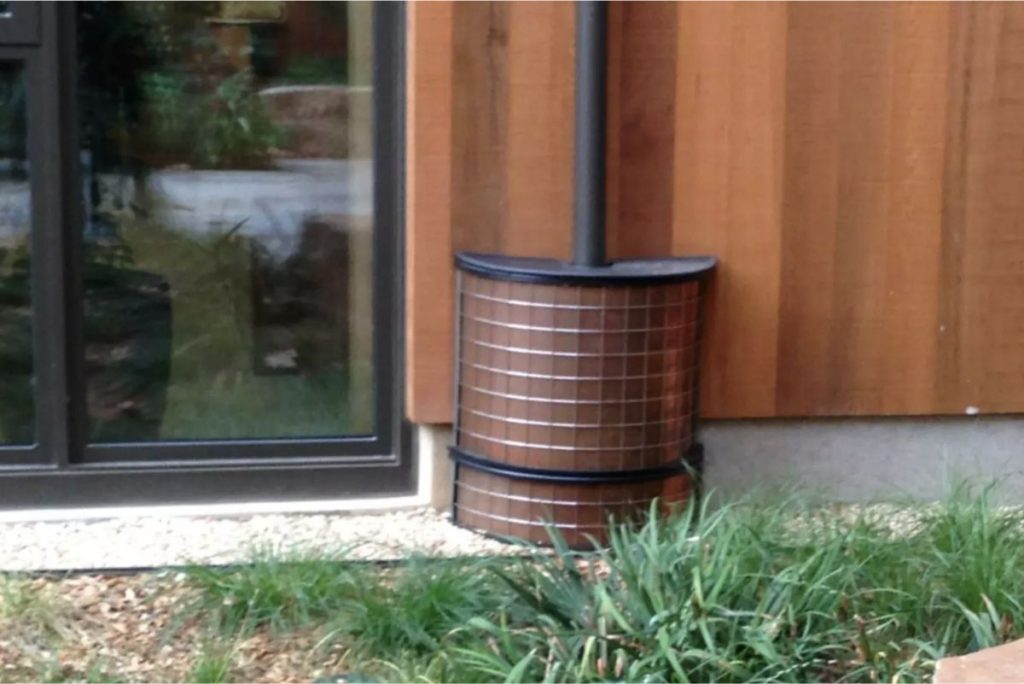
Water Conservation
Reduce water consumption by 40% through:
Storing up to 20,000 gallons of rainwater for irrigation and toilet flushing
Use living green roof and rooftop gutters to assist with rainwater collection
Irrigate only when and where needed using drip irrigation and smart controls
Materials and Waste
Minimize construction waste by:
Recycling 95% of materials from pre-existing buildings
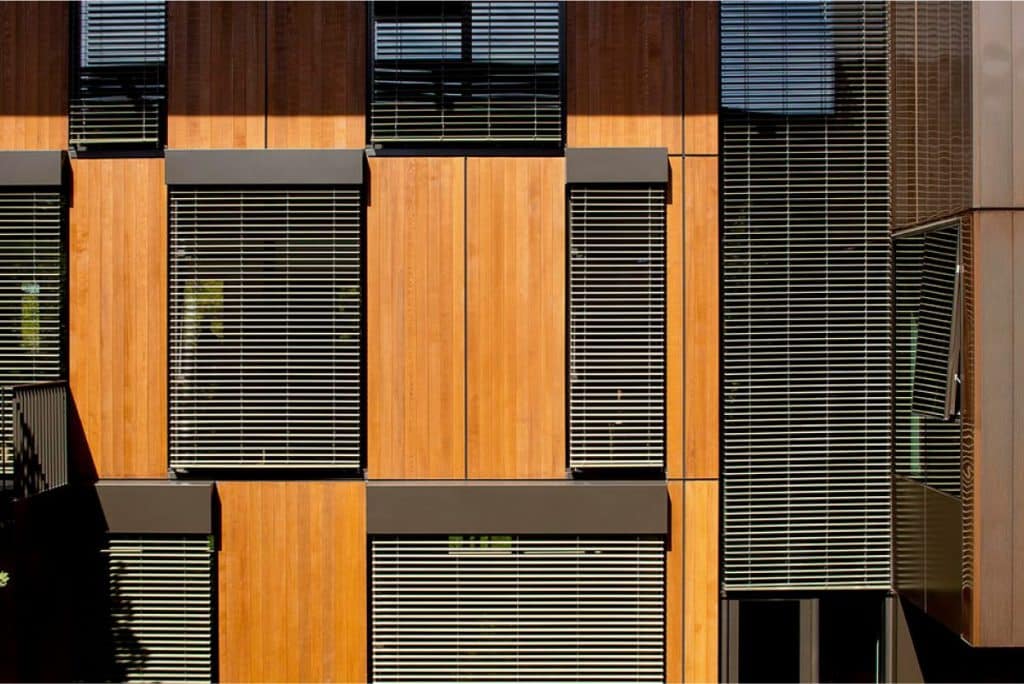
Using FSC (Forest Stewardship Council) certified wood from Oregon
Crafting all interior doors from locally salvaged eucalyptus trees
Ecosystem Impact
Care for local ecosystems by:
Using 90% California native plants in our landscape to eliminate pesticides needed by foreign plants – see our Plant List
Plantings provide familiar food and shelter for local birds and insects and attract native pollinators
Using rain gardens and permeable paving to reduce runoff and filter pollutants
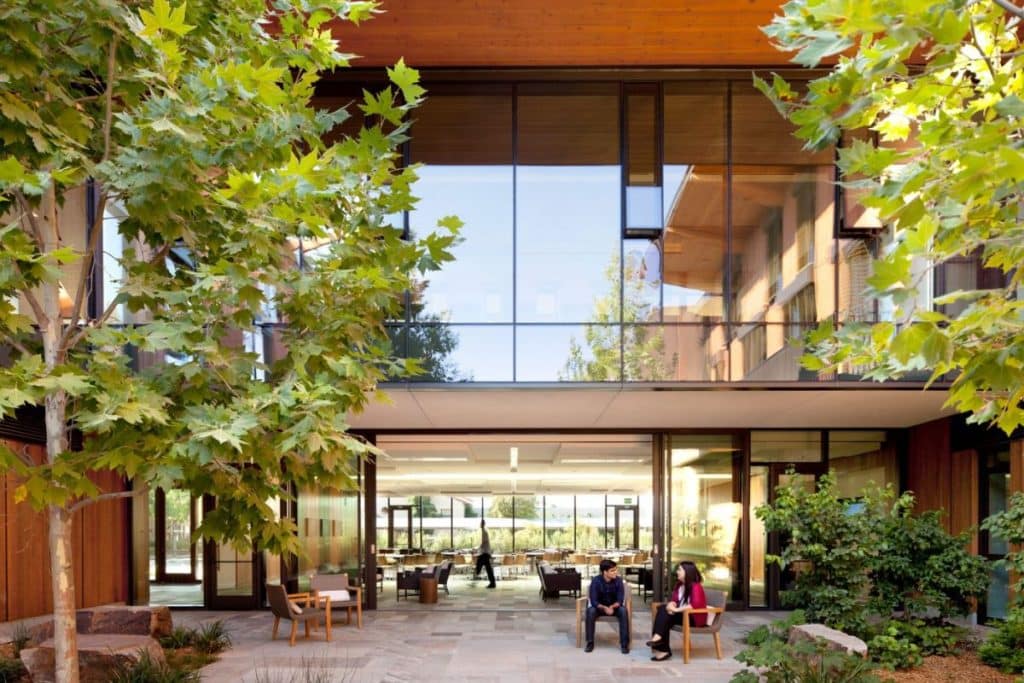
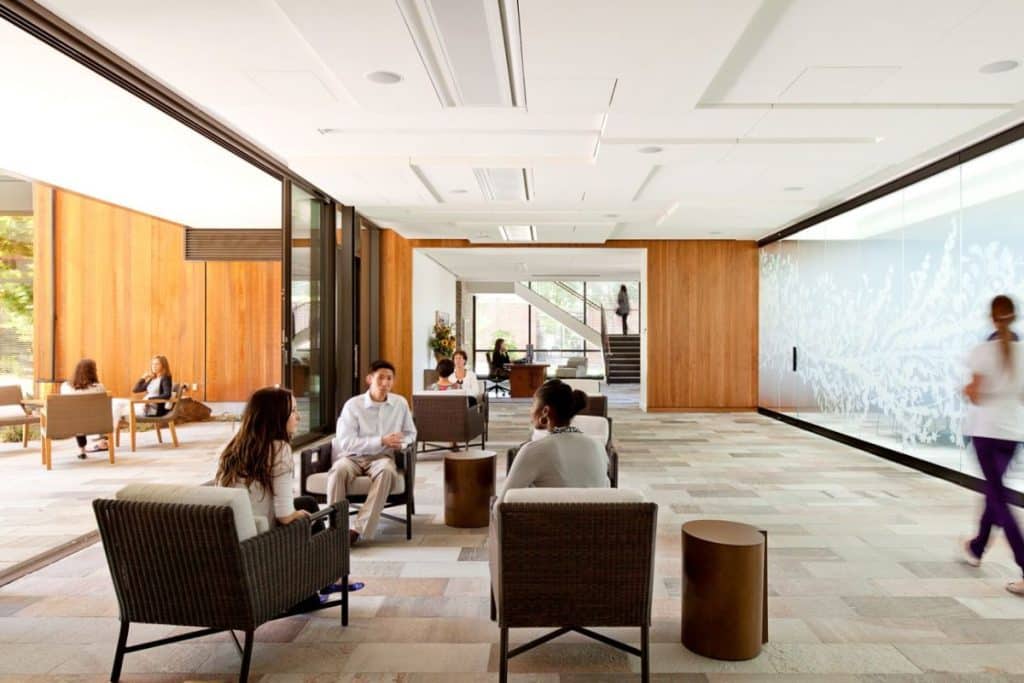
Work Environment
Provide comfortable, healthful environment for employees by using:
100% outside air for ventilation
Paint, flooring, adhesives and other materials that are low in VOC (volatile organic compound) emissions
Operable windows located throughout the building, including floor-to-ceiling glass sliders which open to an enclosed courtyard that offers additional seating.